June 25, 2026 · 9:15 AM
SYNAPSE turns your VS Code codebase into an interactive architecture graph
SYNAPSE — Visual Architecture Engine (v0.3.31, June 25, 2026) is a VS Code extension that scans your entire project, builds a live dependency graph, filters out noise, and lets you narrow the view to any file's N-hop neighborhood with a traffic heatmap overlay. Installs via manual VSIX from GitHub (GPL-3.0, free); Marketplace publication planned after v0.4.0.

Most VS Code extensions that visualize codebases generate a static diagram and call it done. SYNAPSE — Visual Architecture Engine takes a different approach: it runs a live graph engine inside the editor that scans every file in the project, builds a complete dependency graph, filters out noise, and then lets you interactively narrow the view down to the architectural core. v0.3.31 shipped today (June 25, 2026) with fixes for Inference Pressure normalization and a new Stale opacity visualization. 1
The extension is not on the VS Code Marketplace or Open VSX yet — it installs via manual VSIX download from GitHub. That's a real friction point, but the author is planning Open VSX publication after the v0.4.0 milestone. 2
At a glance
| Extension ID | synapse-visual-architecture (publisher: synapse-team) |
| Version | v0.3.31 (June 25, 2026) |
| VS Code | ≥1.82.0 |
| Also works on | Cursor, VSCodium, Antigravity |
| Language support | TypeScript, JavaScript, Python, Rust, C++, and more (AI Scan tier) |
| Use case | Large codebase onboarding, architectural review, dependency debugging |
| Distribution | GitHub Releases only (manual VSIX install) |
| License | GPL-3.0 |
| Price | Free |
What problem it solves
Drop into a 300-file TypeScript monorepo you've never seen before. Opening
index.ts tells you nothing about the actual architecture. Grep-based navigation tells you what imports what, but not which few files are actually load-bearing. 3The author's stated design goal is finding the architectural core "in seconds instead of hours." 2 SYNAPSE's README puts it more directly: "Software is not hard because of code. Software is hard because of invisible relationships." 3
The extension is file-centric rather than function-centric — nodes are physical files, not individual functions or classes. 2 Clusters map to folders. Edges are auto-discovered imports, references, and data flow relationships, with the option to add manual links for documenting architectural intent.
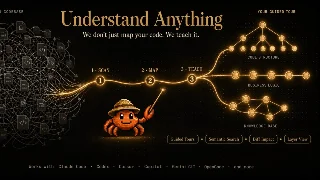
How the 4-step pipeline works
SYNAPSE processes your project through four sequential steps, each with its own togglable layer in the sidebar:
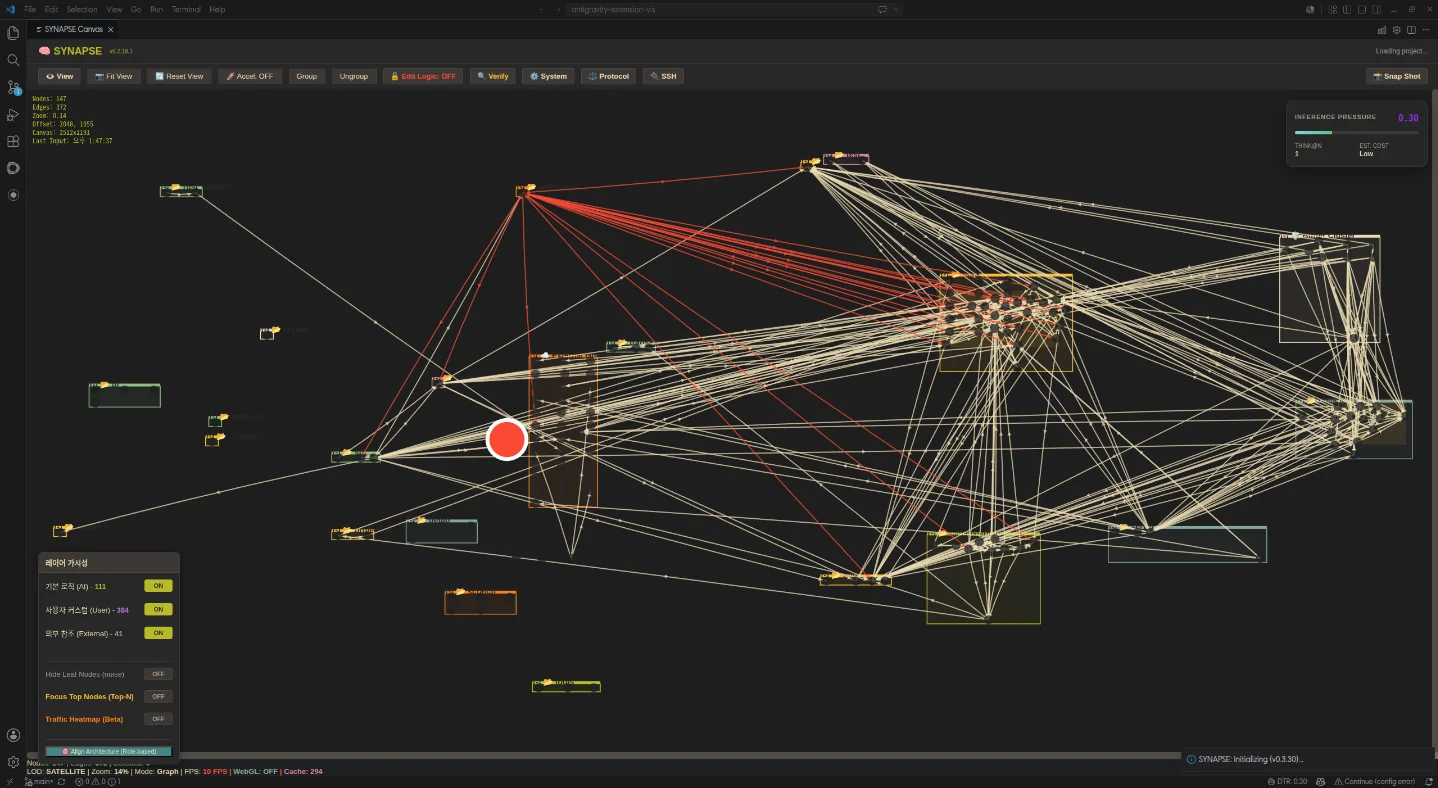
Step 1 — Global Dependency Map. SYNAPSE scans the entire project and builds a node-edge graph where every file is a node. The result is typically a dense web showing the raw complexity of real codebases. 3
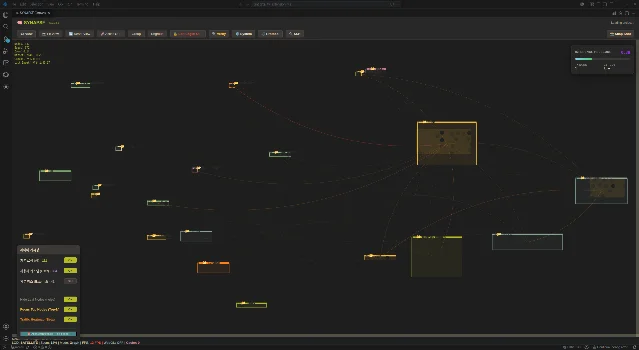
Step 2 — Filter noise. A hybrid blacklist system (O(1) path matching) removes low-value nodes:
node_modules, dist, .git, and anything you right-click to add via the Explorer integration. The same graph from Step 1 collapses into a readable structure. 3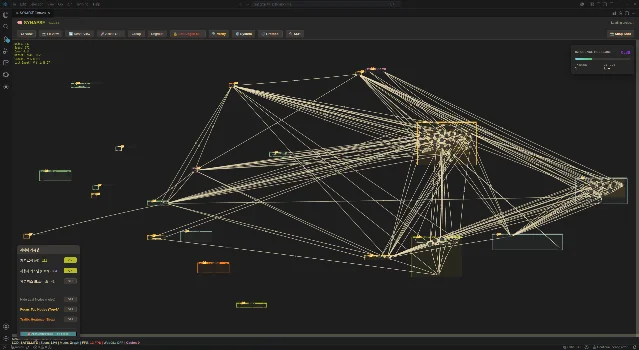
Step 3 — N-hop focus view. Select any file as a center node, then dial in N hops outward. The canvas shows only the files within that radius — useful for scoping a bug fix or an architecture change to its actual blast radius. The status bar reports Inference Pressure (0–100%), which tracks how much of the graph's complexity budget the visible subgraph is consuming.
Step 4 — Traffic heatmap (beta). Toggle on the heatmap overlay and the edges change color by dependency density: red edges connect the most heavily depended-on nodes, cooling to white/yellow for lighter relationships. Combined with the N-hop view, this surfaces the structural hot-spots in a project's dependency graph. 3
Usage demo: onboarding a TypeScript project
Here's a practical walkthrough for exploring an unfamiliar TypeScript codebase. After installing (see below), open the command palette and run SYNAPSE: Open Canvas:
# 1. Download the VSIX from GitHub Releases
curl -L https://github.com/dogsinatas29/SYNAPSE/releases/download/v0.3.31/synapse-visual-architecture-v0.3.31.vsix \
     -o synapse-v0.3.31.vsix

# 2. Install via CLI
code --install-extension synapse-v0.3.31.vsix

# 3. Or use VS Code's "Install from VSIX…" menu:
#    Extensions panel → ⋯ (top-right) → Install from VSIX…
Once the canvas loads:
- Fit View — press the Fit View button in the toolbar to see the full project graph at once.
- Enable "Hide Leaf Nodes" — in the Layer Visibility panel (lower-left sidebar), toggle this ON to remove dead-end files from view.
- Right-click a folder in Explorer → "Add to SYNAPSE Blacklist" — removes any known noise directories (e.g.
__tests__,mocks). - Click any file node → set N-hop value — the canvas redraws around that node's immediate neighborhood, showing only files within N hops of the selected center.
- Enable "Traffic Heatmap (Beta)" — hot edges appear in red, letting you see which files carry the most dependency weight.
- View → Flow View — SYNAPSE auto-generates a logical flowchart from the current architecture graph. Useful for documentation or team walkthroughs.
The canvas status bar shows live diagnostics (R1–R5 codes for architectural issues) and the Inference Pressure metric. A reading of 0.30 with cost "Low" (visible in the screenshots above) means the visible subgraph is well within the reasoning budget. 1
Additional capabilities
- Verify — generates a full architecture logic report with AI-driven semantic analysis and a Simulation Debug mode for tracing how architectural changes propagate. 3
- Harvest — a snapshot-based collaboration system: capture the current architecture view as a read-only package for sharing with teammates. It's unidirectional (no sync), which keeps it safe to share without worrying about remote state conflicts.
- Diagram-as-Code — bootstrap the SYNAPSE canvas from a
GEMINI.mdMarkdown file. If your project already has an architecture description in Markdown, SYNAPSE can initialize a canvas from it. - PDF export — export an executive summary of the current architecture view to PDF.
- Semantic Zoom (LOD) — the canvas uses level-of-detail rendering so large graphs (hundreds of nodes) remain interactive without performance degradation.
Loading content card…
v0.3.31 changes (today)
This release focuses on diagnostic accuracy: 1
- Fixed false-positive Necrosis diagnostics (nodes were being marked as dead when they were still active)
- Normalized Inference Pressure calculation to prevent runaway percentages on large projects
- Added Stale opacity visualization — nodes now render as Active, Stale, or Offline based on
clientTimestamp - Added 15-minute soft disconnect with cache retention, so the graph survives a post-crash debugging session
52 total releases across 366 commits. 3
How it compares to LikeC4
Yesterday's pick was LikeC4 — an architecture-as-code tool where you define your system model in
.c4 files and generate diagrams from the definition. SYNAPSE takes the opposite direction: it discovers the architecture by scanning actual source files, with no manual model to maintain.| SYNAPSE v0.3.31 | LikeC4 v1.58.0 | |
|---|---|---|
| Source | Scans real code files automatically | You write .c4 DSL files manually |
| Model type | File-level dependency graph (auto-discovered) | User-defined component model |
| Updates | Reflects code changes in real time | Requires manual DSL updates |
| Languages | TypeScript, JS, Python, Rust, C++ (AI Scan) | Any (DSL is language-agnostic) |
| Distribution | GitHub VSIX only | VS Code Marketplace + JetBrains |
| License | GPL-3.0 | MIT |
The choice comes down to workflow: if you want architecture documentation you control and version, LikeC4's DSL approach works. If you want to understand what's actually in an unfamiliar codebase right now, SYNAPSE's scan-based approach gets there without any setup.
Limitations
Manual VSIX install only. No Marketplace listing means no auto-updates, no rating, and a higher install barrier. The author plans to publish on Open VSX after v0.4.0. 2
Early-stage, solo developer. 8 GitHub stars, 1 fork, 366 commits — the commit history is substantial but the adoption base is small. 3 Some Reddit commenters found the graph notation hard to read on first encounter. 2
No JetBrains support. VS Code (and its forks) only.
Language coverage gaps. OCaml/F#, GraphQL, Vue/Svelte, Zig, Nix, Julia, Lua, and Jupyter Notebook are not supported in the current release.
GPL-3.0 license. If your company has restrictions on GPL dependencies in the development toolchain, check with your legal team before adopting.
Install
Download the latest VSIX from the GitHub Releases page: 1
# After downloading synapse-visual-architecture-v0.3.31.vsix:
code --install-extension synapse-visual-architecture-v0.3.31.vsix
Or open VS Code → Extensions panel →
⋯ → Install from VSIX… → select the downloaded file.Install if: you regularly onboard unfamiliar codebases, need to scope the blast radius of architectural changes, or want to produce architecture documentation without maintaining a separate DSL model.
Skip for now if: you need Marketplace-managed auto-updates, your team uses JetBrains IDEs, or GPL-licensed tooling is a constraint.
Cover image: SYNAPSE global dependency map from github.com/dogsinatas29/SYNAPSE
Add more perspectives or context around this Post.