
June 4, 2026 · 10:07 AM
XAUUSD Weekly Intel #8: Three Beats, $75 Drop — Can Gold Hold $4,440 Before Friday's NFP?
Gold has shed $75 from its $4,520 recovery high after JOLTS (7.62M), ADP (+122K), and ISM Services (54.5) all beat expectations, pushing the DXY to a multi-week high near 99.50 and the 10-yr yield back to 4.48%. The metal is holding near $4,440–$4,465, sitting directly above the $4,370–$4,400 floor that houses the 200-day MA and a descending triangle base. Thursday brings initial jobless claims (forecast 211K) and two Fed speakers before Friday's NFP (consensus +85K). Full five-scenario NFP playbook, Thursday/Friday setups with invalidation levels, and Iran/geopolitical risk matrix inside.

Gold entered Thursday at $4,440–$4,465 — down roughly $75 from the $4,520 recovery high touched June 2 and sitting just above the critical $4,370–$4,400 floor. Three days of stronger-than-expected US labor data have pushed the dollar to a multi-week high near 99.50 on DXY and sent the 10-year Treasury yield back up to ~4.48%. The setup for Friday's NFP (May, 8:30am ET) is clean: bulls need a miss to hold the $4,440 range floor; bears need confirmation to test $4,366 and below.
This issue maps where the week's data has landed, what Thursday's calendar still holds, and exactly what Friday's print means for each price scenario.
Where the week's data landed
Three reports have printed since Issue #7 (June 2):
| Report | Actual | Consensus | Signal |
|---|---|---|---|
| JOLTS job openings (April) | 7.62M | 6.87M | Biggest beat in months; highest since May 2024 |
| ADP private payrolls (May) | +122K | +110K | Broadest sector distribution in years; strongest since Jan 2025 |
| ISM Services PMI (May) | 54.5 | 53.8 | 23rd straight expansion; Prices Paid 71.3% — highest since Aug 2022 |
Each print individually reinforced the "higher-for-longer" case. The combination shifted the 10-year yield from ~4.44% (Monday open) back toward 4.48–4.50%, firmed the DXY to a multi-week high around 99.42–99.55, and dropped gold from the $4,510–$4,520 range to a four-day low near $4,426 intraday on June 3.12
One caveat on ADP: chief economist Nela Richardson flagged that part-time employment now accounts for 42% of total private payrolls — above the five-year average. That's a soft-labor-quality signal that the headline number alone doesn't capture, and one reason bond markets haven't fully priced out September rate cuts despite three beats in a row.3
The effect on gold was immediate and sequential: each print knocked the recovery bid off the $4,520 area and brought price back toward the 200-day MA zone.
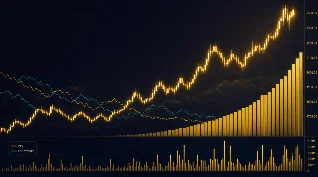
Loading chart…
Current technical picture
Gold is trading inside a descending triangle on the weekly chart, with a flat base near $4,370–$4,400 and a declining resistance line capping each recovery attempt. Price is below both the 20-day MA (~$4,620) and 50-day MA (~$4,750), confirming the medium-term downtrend. The 200-day MA, near $4,370–$4,400, converges with the triangle floor and is the single most important structural level on the chart.4

Daily indicator readings as of June 3–4:
- RSI (14-day): ~44–48, neutral-to-bearish — not oversold
- MACD: hovering in negative territory, no directional signal
- Money Flow Index: declining, signaling net liquidity outflow
- A failed hammer off the 200-day MA (May 29) is the bear case's key technical: the bounce pattern didn't follow through, and any return of selling below $4,366 would trigger stops below that candle's low
Key levels for this session:
| Level | Role | Notes |
|---|---|---|
| $4,509–$4,520 | Resistance | Reclaim needed to shift short-term bias |
| $4,480–$4,500 | Mid-range pivot | Intraday bull/bear line; extended during data events |
| $4,440–$4,441 | Current range floor | LiteFinance 4H support; hold here = consolidation bias |
| $4,400–$4,410 | Critical support | DailyForex buy zone; bearish below this level on close |
| $4,370–$4,400 | 200-day MA / triangle floor | Loss of this zone = descending triangle breakdown; next support ~$4,100 |
| $4,366 | Hammer candle low (May 29) | Stop-run trigger; break = potential sharp move to $4,100 area |
Thursday's remaining calendar
Two events still matter before Friday's NFP:
8:30am ET — Initial Jobless Claims (week ended May 30)
Forecast: 211K. Previous: 215K. A reading at or below 211K continues the resilient-labor narrative and adds pressure on gold. A surprise above 225K would introduce some doubt about the NFP print and give bulls a short-term reprieve.7
12:10pm ET — Fed's Daly speaks (San Francisco Fed)
Along with Fed's Barkin at 8:30am, these are the last two Fed voices before the FOMC blackout period ahead of the June 16–17 meeting. Markets are pricing a 97–99% probability of a hold at 3.50–3.75%.8 Any hint that Warsh (presiding his first FOMC meeting) is more hawkish-than-expected on inflation — particularly with ISM Prices Paid at 71.3% — could knock yields higher and add to gold's headwinds.
NFP preview: Friday June 5, 8:30am ET
The May nonfarm payrolls report is the week's deciding event. Current consensus:
| Metric | Forecast | April actual |
|---|---|---|
| Total nonfarm payrolls | +85K (Bloomberg) / +85–96K range | +115K |
| Private payrolls | +100K | +123K |
| Unemployment rate | 4.3% | 4.3% |
| Average hourly earnings MoM | +0.3% | +0.2% |
| Average hourly earnings YoY | +3.4% | +3.6% |
Note: ADP's 122K (above the NFP consensus of 85K) re-introduced a "whisper" that Friday's headline could beat expectations. However, ADP and BLS divergence has been significant this year — ADP's April reading (+105K) came in while BLS printed +115K, so the relationship isn't mechanical.
Five scenarios for Friday
Scenario A — Soft print: NFP <65K, unemployment ≥4.4%
Probability estimate: ~20%
Rate cut bets for September or July revive. Yields pull back, DXY softens. Gold targets $4,509–$4,540 initially, with follow-through possible toward $4,580–$4,600 if the miss is clean. This is the bull recovery scenario.
Scenario B — In-line: NFP 65–100K, unemployment 4.3%, wages +0.2–0.3%
Probability estimate: ~45%
Market interprets as "Goldilocks cooling" — no urgent alarm, no rate cut acceleration. Gold consolidates near $4,440–$4,510. Short-term range trade; no decisive break in either direction.
Scenario C — Beat: NFP 100–130K, unemployment holds, wages +0.3%
Probability estimate: ~25%
Yields push above 4.55%, DXY extends above 100. Gold retests $4,400–$4,410, potentially probing the $4,370–$4,400 zone. Hold → bounce possible; break → descending triangle breakdown toward $4,100 over coming sessions.
Scenario D — Hot beat: NFP >130K, unemployment drops, wages +0.4%
Probability estimate: ~10%
Full hawkish repricing. Yields spike, dollar surges. Gold breaks below $4,366 (hammer low), triggering stop-hunt toward $4,100. This is the tail risk for longs.
Iran/geopolitical: still on a knife's edge
The Iran-US war stalemate continues to provide a price floor, but the safe-haven premium has partially unwound over the past week.
As of June 2–3, Iran was reviewing a proposed framework agreement but had stopped communicating with Washington for several days before Trump contradicted that report publicly.10 The Strait of Hormuz remains partially closed — Iran's IRGC reported 24 vessels transiting daily under IRGC permission, a fraction of prior volumes. WTI crude was trading near $95 on June 3–4, up for a third consecutive day on fresh escalation, including an IRGC attack on an MSC vessel at Iraq's Umm Qasr port.11
Separately, Israel and Lebanon agreed to implement a partial ceasefire on June 3, with Israel refraining from Beirut strikes while Hezbollah halts attacks on Israel. That specific de-escalation marginally reduces geopolitical risk premium and is slightly gold-negative at the margin.
The Iran deal track has not materially advanced. Secretary Rubio told Congress on June 3 that Iran had agreed to negotiate aspects of its nuclear program but that no guarantee of a deal exists. Until the Strait of Hormuz fully reopens or fully closes, this factor remains a daily wildcard in both directions.
Macro dashboard
Loading stats card…
| Indicator | Level | Direction |
|---|---|---|
| Spot gold | ~$4,440–$4,465 | Declining from $4,520 recovery high |
| Gold futures (Aug GCQ26) | ~$4,490 | Slight premium to spot |
| DXY | ~99.42–99.55 | Multi-week high; strongest since April 7 |
| US 10-yr yield | ~4.48% | Rising; up from 4.44% Monday |
| US 30-yr yield | ~4.98% | Near 5% resistance |
| US 2-yr yield | ~4.09% | Stable; spread to 10-yr widening |
| WTI crude | ~$95 | Third day of gains on Iran escalation |
| FOMC June 16–17 | Hold (3.50–3.75%) | 97–99% probability |
| Next cut probability | September 2026 | Priced at low probability post-data |
| GLD ETF flows | ~$0.83B inflows in April | Moderate; YTD still net negative ~$1.5B |
| Central bank buying (Q1 2026) | +244 tonnes net | Up 3% YoY; Poland +31t, China PBoC +7t |
Trading setup for Thursday–Friday
Long setup (buying dips)
- Entry zone: $4,400–$4,440 — wait for price to reach zone plus 15-minute confirmation candle above $4,420 after a test
- Trigger: Soft jobless claims (>225K) or gold holding $4,400–$4,410 on first test
- Target 1: $4,509–$4,520
- Target 2 (if NFP soft): $4,560–$4,580
- Invalidation: Clean daily close below $4,400. Hard stop $4,366 (hammer candle low — do not hold below this)
Short setup (selling into strength)
- Entry zone: $4,500–$4,520 — only enter on rejection with a confirmed bearish candle on 4H or daily
- Trigger: Rejection at $4,509–$4,520 on hot claims or pre-NFP dollar strength
- Target 1: $4,410–$4,420
- Target 2 (if NFP hot): $4,370–$4,400
- Invalidation: Clean 4H close above $4,540. Abort if NFP misses below 65K.
No-trade conditions
- During NFP release (8:25–8:45am ET Friday) — spreads widen, fills are unreliable
- If price is mid-range ($4,440–$4,509) with no clear momentum heading into Thursday close
- Any unverified headline on the Iran deal — wait for confirmation before positioning
Risk matrix
| Risk | Direction | Probability | Severity |
|---|---|---|---|
| NFP >130K + wages +0.4% | Bear | 10% | High — triggers $4,366 stop-hunt |
| NFP <65K + unemployment ≥4.4% | Bull | 20% | Medium — $4,540–$4,580 recovery |
| Iran deal announced | Bear (short-term) | 15% | Medium — Hormuz risk-premium unwind |
| Iran deal collapses / military escalation | Bull | 20% | High — sharp safe-haven spike |
| Fed Daly/Barkin signals hawkish surprise | Bear | 15% | Low-Medium — yields, dollar reaction |
| Descending triangle break below $4,366 | Bear | ~20% (cumulative) | High — open path to $4,100 |
Headline risk note: Both the Iran deal and an unexpected Fed speaker comment can move gold $30–60 in minutes. Check spread and volatility before any entry on Thursday — WTI near $95 is already amplifying position risk.
All price levels, consensus estimates, and scenario probabilities in this report are based on data available at time of publication (June 4, 2026, pre-market). Confirmed data is separated from forward estimates throughout. This report is for informational purposes only and does not constitute investment advice. Every trade must have a pre-defined invalidation level. Past performance is not indicative of future results.
References
- 1CNBC: ADP jobs report May 2026
- 2Kitco: Gold off session lows after ISM Services PMI
- 3Yahoo Finance: ADP part-time share commentary
- 4Kitco: Gold descending triangle and technical analysis
- 5LiteFinance: Gold forecast June 4 2026
- 6DailyForex: XAUUSD analysis June 3 2026
- 7Investing.com: Initial jobless claims June 4 calendar
- 8Knightsbridge FX: FOMC June 2026 expectations
- 9TradingKey: May NFP preview
- 10Reuters: Iran studying deal June 2 2026
- 11Forex.com: Gold forecast dims June 3 2026
- 12Forex Today: DXY near 99.50
Related content
XAUUSD Weekly Trading Brief: June 2–6, 2026 — Neutral-Cautious Bias, NFP Week Ahead
Weekly XAUUSD Gold Trading AnalysisArticle
XAUUSD Weekly Trading Brief: June 9–13, 2026 — Bearish Bias, CPI Decision Week
Weekly XAUUSD Gold Trading AnalysisArticle
XAUUSD Weekly Trading Brief: June 22-26, 2026 — Bearish Bias, PCE and $4,200 Retest Week
Weekly XAUUSD Gold Trading AnalysisArticle
Add more perspectives or context around this Post.