
May 31, 2026 · 11:50 PM
XAUUSD Weekly Intel #5: NFP Week Is Here — Gold at $4,557, Yields at 4.44%, Setup for a $4,630 Breakout or $4,420 Flush
Gold enters NFP week at $4,557 with the bull/bear line at $4,481 reclaimed, the 10-year yield down 12bp to 4.44%, and $2.34B in GLD inflows confirmed. This issue maps the full June 2–6 price channel, a 10-event news impact table, 5-day daily outlook with probability scenarios (Bull 40% / Base 40% / Bear 20%), and concrete long/short setups with defined invalidation levels. Friday NFP (consensus ~93–95K) is the defining catalyst.

Sunday May 31, 2026 | Pre-market brief for the week of June 2–6
Gold enters NFP week in the best shape it has been since early May. After a violent $150 intraday reversal off the 200-day MA on Thursday May 28 and a strong Friday close, spot gold finished the week near $4,557 while the 10-year Treasury yield completed its biggest single-week pullback since April — dropping 11–12 basis points to 4.44%. The bull/bear dividing line at $4,481.78 has been reclaimed and held for two consecutive closes. The GLD ETF confirmed $2.34 billion in weekly inflows for the week ended May 20. The US-Iran ceasefire Memorandum of Understanding is under Trump review — not signed, but the market is already treating it as directionally positive.
This week has one job: confirm or deny the bull case. Friday June 6 is NFP day. Everything from Monday's ISM Manufacturing through Wednesday's ADP feeds directly into the reaction function for a single question — is the labor market cooling fast enough to push the Fed toward eventual cuts, or holding firm enough to keep the rate-hike tail risk alive? Gold's answer to that question will set the directional bias for the rest of June.
Market dashboard entering the week
Loading stats card…
Sources: Investing.com, TheStarOnline/Reuters (May 30); Atranica Capital / BondBeat weekly wrap (May 31); Newsquawk calendar; CME FedWatch (May 29); LSEG Lipper via Zacks/Reuters (week ended May 20); US State Department per Reuters/Axios.
Weekly price channel map (June 2–6)
The following levels are derived from the confirmed price action as of Friday May 30 close, the reclaimed $4,481.78 bull/bear line, and the primary moving averages updated in Issue #4.
| Zone | Level | Status |
|---|---|---|
| Breakout target | $4,630–$4,634 | 50-day MA; prior swing high |
| Resistance 2 | $4,589 | 20-day MA; first meaningful barrier |
| Resistance 1 / weekly high | $4,558–$4,570 | Friday close zone; active resistance |
| Bull/bear line | $4,481.78 | Reclaimed — must hold for bull thesis |
| Support 1 | $4,460–$4,481 | Intraday consolidation zone |
| Support 2 | $4,420–$4,440 | Gap-fill / prior breakdown cluster |
| 200-day MA | $4,394–$4,401 | HELD twice; structural support |
| Hard invalidation | $4,366.23 | Thursday May 28 intraday reversal low |
| Deep bear target | $4,340–$4,320 | 4H Fib extension zone |
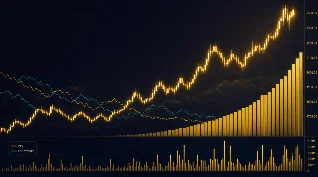
Loading chart…
Midline: $4,520 (midpoint between $4,481 support and $4,558 resistance). Price opened the week above midline — bullish positioning but not yet at the breakout trigger.
ATR context: Average True Range has been elevated (~$80–100/day) since the May 26–28 volatility spike. Expect wide daily ranges; a $4,481 defense with intraday dips to $4,460 is still technically valid. Avoid mid-range entries.
Technical structure: where does gold stand?
Gold's May-June correction was a textbook double-bottom at the 200-day MA — both tests ($4,388 on May 27, $4,366 on May 28) produced immediate rejections. This matters because it shifts the burden of proof back to bears: to invalidate the recovery, sellers need a daily close below $4,481, not just an intraday dip. 1
Daily trend: bias has flipped back to bullish above $4,481. The 50-day MA at $4,630–$4,634 is the next meaningful target; a sustained move there would erase the entire May correction.
4H structure: three consecutive higher-lows since the Thursday bottom. Any pullback that holds above $4,460 keeps the structure intact. A 4H close below $4,440 would suggest the recovery is losing steam.
Key moving averages (confirmed May 29 close):
- 20-day MA: ~$4,589 (first resistance / target)
- 50-day MA: ~$4,630–$4,634 (key resistance)
- 100-day MA: ~$4,804 (long-term anchor)
- 200-day MA: ~$4,394–$4,401 (twice-confirmed structural support)
Fibonacci context: the 61.8% retracement from the April–May highs sits near $4,397 — right on top of the 200-day MA. Both triggered simultaneously in the May 28 reversal, reinforcing the structural significance of that zone.
Macro dashboard
Federal Reserve and rates
The Fed is going nowhere in June. CME FedWatch shows 99.2% probability of a hold at the June 17–18 FOMC meeting.2 The more consequential market debate is whether the first cut or the first hike comes sooner — and this week's jobs data will directly inform that.
Current positioning, per multiple bank forecasts published May 29:
- UBS: projects FOMC on hold until March 2027; first cut at 25bp, then June/December 2027 3
- Deutsche Bank: raised 10-yr UST target to 4.70% from 4.45%, sees risk tilted toward a hike 3
- Barclays: forecasts 75K NFP with unemployment staying at 4.3%; expects FOMC to hold extended pause 3
- Morgan Stanley: strategic bull on bonds; expects yields to decline into summer as IG issuance dries up; flagged May NFP as the key test 3
The 10-year fell to 4.44% last week — down from the 4.69% intraday peak on May 19. BondBeat notes major support for the 10-yr sits in the 4.20s range (200-day at 4.20%), with the 50-day at 4.39%.3 Hedge fund positioning data (CoT as of May 26): non-commercials net short 788K 10-yr contracts, down 60K on the week — shorts are covering, which is yield-positive for gold.
5-yr breakeven inflation: 2.54% as of late May — only modestly above the Fed's informal tolerance zone, per the Calafia Beach Pundit macro chart digest.3 This reading is not alarming by historical standards and limits the rate-hike argument.
Real yield and TIPS spread: not confirmed this week — flagged as a data gap. Directionally, the 12bp yield drop on the week, with inflation expectations little changed, implies real yields declined modestly. That's constructive for gold.
US-Iran ceasefire
The MoU framework — 60-day ceasefire extension, Strait of Hormuz mine removal within 30 days if signed, limited sanctions relief, formal nuclear talks — is under Trump review as of Friday May 30.4 Trump ended an Iran meeting Friday "without announcing a final determination."5 Iran's Tasnim agency separately reported the MoU text has not been finalized or confirmed.
For gold, this creates a binary risk: a signed deal removes the safe-haven premium built into the current price, likely $50–80 of it. A breakdown in talks would immediately refuel safe-haven demand and could push gold through $4,600+ quickly. The current price already discounts partial progress — this is not yet a full ceasefire premium.
BCA Research said prospective ceasefires in Iran and Ukraine may provide "only limited relief for global markets."6
DXY and currency context
DXY ended the week down 0.3%, holding near 98.85–99.00.7 The dollar weakened on Iran ceasefire optimism and the rates pullback. A DXY break below 98.00 would add meaningful tailwind for gold. USD/JPY is approaching the ¥160 BoJ intervention threshold — any yen-driven dollar weakness cascades into gold.
Gold ETF flows and sentiment
GLD ETF confirmed $2.34 billion in weekly inflows for the week ended May 20, per LSEG Lipper data via Reuters.8 Gold volatility index (GCVL) stood at 24.16 on May 29 — elevated but not panicked, consistent with a market that is directionally uncertain but skewed long. GLD put-to-call ratios and Hulbert advisor surveys were approaching buy-signal territory per Seeking Alpha (Issue #4). The GLD tonnage breakdown and central bank May buying data remain unconfirmed.
Key macro data already in hand (from last week)
- GDP Q1 2026 (2nd est., BEA): +1.6% annualized; below +2.0% consensus; real final sales to private domestic purchasers +2.4% — weak headline, reasonable underlying 7
- Core PCE April (confirmed May 28): +0.2% MoM (softer than +0.3% expected); +3.3% YoY — the monthly reading was good; the annual rate is still too hot for cuts 7
- Jobless claims (week ended May 24): 215K vs. 211K expected — slight miss; labor is cooling but not breaking
- S&P Global Manufacturing PMI Flash (May): 55.3 — 48-month high; driven by precautionary stock-building, not end demand; input cost inflation at a multi-year high 9
- Consumer confidence (May): Conference Board index slipped to 93.1; two-thirds of respondents said they were cutting spending due to higher prices 7
- Personal savings rate: 2.6% — lowest since 2022; households are running down savings to maintain spending levels 7
- China central bank: 17+ consecutive months of gold buying (ongoing; no May data yet)
- UBS 2026 gold price forecast: $5,500/oz
News impact table: June 2–6, 2026
| Day | Event | Consensus / expected | Expected gold impact | Bull logic | Bear logic |
|---|---|---|---|---|---|
| Mon Jun 2 | ISM Manufacturing PMI (May) | ~52.5 (Wells Fargo); S&P flash 55.3 | Low–medium | Beat + prices paid cooling = DXY soft, rates down, gold up | Miss + prices paid hot = stagflation fear, Fed hold/hike, gold down |
| Tue Jun 3 | JOLTs job openings (Apr) | No consensus available | Low | Large drop → labor cooling → gold supported | Elevated → labor still tight → less urgency for cuts |
| Tue Jun 3 | Fed speakers: Kashkari, Hammack | Hold bias expected | Medium | Dovish language → yields fall → gold up | Explicit hike discussion → yields spike → gold sell |
| Wed Jun 4 | ADP employment (May) | No consensus provided | Medium | Soft print <80K → NFP worry increases → gold bid | Strong print >150K → NFP expectations revised up → gold soft |
| Wed Jun 4 | ISM Services PMI (May) | ~53.4 (Wells Fargo); S&P flash 50.9 | Medium | Miss (esp. prices paid) → inflation cooling = rates down, gold up | Beat + prices paid hot → stagflation pressure |
| Wed Jun 4 | Fed Beige Book | — | Low–medium | Weak economic conditions language → rates plateau confirmed | "Broadening inflation" → hike rhetoric gains traction |
| Thu Jun 5 | Jobless claims (week May 30) | ~210K exp. | Low | >225K = labor weakening → gold supported | <195K = labor tight, Fed hawkish |
| Thu Jun 5 | Fed speaker: Daly | Hold expected | Medium | Any softening on rate path → yield drop → gold up | "Open to hike" → yields spike |
| Fri Jun 6 | US NFP (May) — defining event | 95K (consensus); 75K (Barclays) | Very high | <80K → 10-yr falls to 4.20–4.30, DXY breaks 98, gold surges to $4,630+ | >180K → 10-yr tests 4.60–4.70, DXY rallies, gold drops toward $4,420 |
| Fri Jun 6 | Unemployment rate (May) | 4.3% unchanged | High | Rise to 4.4%+ → labor market deteriorating → gold bid | Drop to 4.2% → Fed tilts hawkish |
| Fri Jun 6 | AHE (May) | +0.3% MoM, 3.4% YoY | High | Below +0.2% → wage growth cooling → gold up | Above +0.4% → wage-price spiral risk → gold down |
5-day price outlook (Mon–Fri)
Overall bias entering the week: conditionally bullish above $4,481
| Day | Expected trading range | Directional lean | Key level to watch |
|---|---|---|---|
| Mon Jun 2 | $4,490–$4,580 | Mildly bullish | Hold above $4,481 on any Monday open dip; ISM at 10am ET |
| Tue Jun 3 | $4,480–$4,570 | Neutral | JOLTs + Fed speakers; choppy day likely |
| Wed Jun 4 | $4,470–$4,590 | Event-driven | ADP + ISM Services + Beige Book; directional clarity possible |
| Thu Jun 5 | $4,480–$4,600 | Building toward Friday | Pre-NFP positioning; light volume; fade extremes |
| Fri Jun 6 | $4,350–$4,680 | High volatility; trend-defining | NFP day: wide range; hold for close confirmation before acting |
Weekly probability scenarios
Loading stats card…
Bull scenario (40%): NFP prints below 100K — ideally in the 75–95K range that three of four major bank forecasts cluster around. The 10-yr yield drops from 4.44% toward 4.20–4.30%, DXY tests and likely breaks 98.00, and gold punches through $4,558–$4,570 resistance toward the 50-day MA at $4,630–$4,634. A ceasefire MoU signing this week would add $30–50 and then quickly give some back as safe-haven premium unwinds — but the underlying bullish technical structure holds.
Base scenario (40%): NFP 100–150K. Labor is clearly cooling but not collapsing. Yields drift lower on the week but stay above 4.30%. Gold consolidates between $4,460–$4,540, failing to break $4,558 definitively. Traders wait for clearer data before committing. This week ends with the same setup as it started — bullish structure intact, but no confirmation.
Bear scenario (20%): NFP surprises above 180K. The Barclays standard claims-based model actually supports the strong-print possibility — initial claims have been subdued since April's reference week.3 A strong number forces the market to reprice the hike risk that Deutsche Bank is already calling for. The 10-yr tests 4.60–4.70%, DXY rallies back above 100, and gold breaks $4,481 on a daily close — opening the door to $4,420 and possibly re-testing the $4,394–$4,401 200-day MA zone.
Trading strategy
Long setup
Thesis: bullish recovery above $4,481, targeting the 50-day MA cluster.
| Parameter | Level |
|---|---|
| Entry zone | $4,490–$4,510 (intraday dip into support early week) |
| Confirmation trigger | Daily close above $4,558 (Friday weekly high) |
| Target 1 | $4,589 (20-day MA) |
| Target 2 | $4,630–$4,634 (50-day MA) |
| Stop / invalidation | Daily close below $4,481.78 |
| Hard invalidation | Close below $4,366.23 |
| Risk:reward at entry zone | ~1:2.5 to T1 / ~1:4 to T2 |
Execution rule: do not enter at mid-range ($4,520–$4,540). Entries only near $4,490–$4,510 support with a confirmed intraday hold. On breakout above $4,558, require a 4H candle close above — not just an intraday touch — before adding.
NFP day rule: do not initiate long positions in the 30 minutes before or after the NFP release. Enter only after the first hourly close post-release settles directionally.
Short setup
Thesis: false breakout above $4,558 reverses; or NFP-driven breakdown below $4,481.
| Parameter | Level |
|---|---|
| Entry zone | $4,555–$4,570 (intraday spike into resistance with no follow-through) |
| Confirmation trigger | 4H close back below $4,540 after touching $4,558+ |
| Target 1 | $4,481 (bull/bear line) |
| Target 2 | $4,440–$4,460 |
| Stop / invalidation | Daily close above $4,589 (above 20-day MA) |
| Risk:reward at entry | ~1:2 to T1 / ~1:3 to T2 |
NFP breakdown variant: if NFP >180K and gold closes below $4,481 on the day, short trigger activates with entry at $4,475–$4,481 on first retest of the broken bull/bear line. Target: $4,420, stop: $4,510.
No-trade conditions
- Any position held through the NFP release without a pre-set stop already in place
- Gold trading between $4,510 and $4,540 mid-week with no directional catalyst
- Any session where the US-Iran deal status shifts abruptly (gap-open risk)
- Spreads >$2.50 or volatility spike without clear direction
Risk warnings
Main risk: NFP is a binary event with wide uncertainty. Barclays has an unusually wide confidence band on their forecast, noting standard claims-based models and alternative indicators are sending conflicting signals.3 UBS additionally flags potential NFP overstatement — BEA's income revisions suggest QCEW data may imply the monthly employment report has been running above underlying trend.3 Either direction is a real risk.
Fake-move risk: the $4,558–$4,570 zone is likely to see an intraday spike and rejection attempt before NFP. Pre-NFP positioning often drives false breakouts in both directions. The rule is 4H close confirmation — not the first tick through a level.
News risk: the Trump administration could announce an Iran ceasefire signature or rejection at any time this week, including outside US market hours. A signing would likely gap gold down $30–50 on immediate safe-haven unwind, then stabilize. A deal collapse would send gold $50+ higher within hours. Pre-set protective stops on all positions.
Rate hike tail risk: Deutsche Bank raised its 10-yr yield target to 4.70%, citing elevated inflation breadth — 82% of the PCE basket is running at a higher inflation rate than in 2018.3 If Kashkari or Daly delivers explicitly hawkish language mid-week, yields could re-test 4.55–4.60% before NFP, which would pressure gold to the lower end of the base case.
Data gaps this issue: real yields / TIPS spread (unconfirmed); GLD ETF tonnage breakdown (unconfirmed); central bank gold buying May data (unconfirmed; China confirmed buying 17+ months but May report not yet available).
Disclaimer: All levels, scenarios, and setups in this report represent analytical assessments based on publicly available market data as of Sunday May 31, 2026. Confirmed data is clearly separated from forward estimates. Probability estimates are directional judgments, not guarantees. No guaranteed-profit language is used. Trading gold involves substantial risk of loss. This report is for informational purposes only and does not constitute investment advice.
12345678910References
- 1XAUUSD Weekly Intel #4: Friday Close
- 2CME FedWatch via WEEX.com
- 3UBS US Economics Weekly — Employment Report and Fed in a Bind
- 4Gold climbs as US-Iran ceasefire talks weigh on oil and temper Fed rate hike bets
- 5Trump ends Iran meeting without announcing final determination on deal
- 6Will ceasefires in Iran and Ukraine be enough to stabilize markets?
- 7Week #22 Market Update for May 25–29, 2026
- 8Gold ETFs shine again as ceasefire hopes lift market optimism
- 9Week in Focus: US ISMs, NFP, EZ HICP and Canadian Jobs Take Center Stage
- 10Newsquawk Weekly Economic Calendar 1–5 June 2026
Related content
XAUUSD Weekly Trading Brief: June 2–6, 2026 — Neutral-Cautious Bias, NFP Week Ahead
Weekly XAUUSD Gold Trading AnalysisArticle
XAUUSD Weekly Trading Brief: June 9–13, 2026 — Bearish Bias, CPI Decision Week
Weekly XAUUSD Gold Trading AnalysisArticle
XAUUSD Weekly Trading Brief: June 22-26, 2026 — Bearish Bias, PCE and $4,200 Retest Week
Weekly XAUUSD Gold Trading AnalysisArticle
Add more perspectives or context around this Post.