June 15, 2026 · 8:29 AM
XAUUSD Weekly Intel #17: Iran Deal Confirmed — Gold Up $88, But Warsh Decides Wednesday
Gold surged $88 to ~$4,307 on the confirmed US-Iran peace deal (Strait of Hormuz to reopen, signing expected Friday), while oil crashed 4.75% and the dollar slipped. But the deal hasn't been signed yet — and Warsh's FOMC dot plot Wednesday owns the rest of the week. This issue maps the full technical channel from $4,023 to $4,446 (MA200), five FOMC scenarios with probability estimates, the week's five-central-bank calendar, and long/short setups with defined invalidation levels.

The setup entering Monday
Gold opened Monday at $4,219.32 — exactly where it closed Friday — and by late morning in Asia was trading near $4,307, up $88 or +2.1% on the session.1 The catalyst: the US and Iran announced a peace deal on Sunday June 14, confirming an end to nearly four months of military conflict.
The day range so far is $4,219.32–$4,308.93. Gold futures (August) are at $4,324.42.1 For context on why this move matters: last week, gold hit a six-month low of $4,023 on June 11, then surged $212 intraday on Thursday as the first Iran deal reports emerged, only to pull back as Tehran disputed the terms. Spot closed last week at $4,219, down 2.6% on the week.2
The macro scoreboard Monday morning:
Loading stats card…
| Instrument | Level | Change |
|---|---|---|
| XAUUSD spot | ~$4,307 | +$88 / +2.1% |
| Gold futures (Aug) | $4,324 | +$86 / +2.0% |
| DXY (dollar index) | ~99.19 | −0.31% |
| US 10-yr yield | 4.418% | −6.5bp |
| US 2-yr yield | ~4.09% | — |
| WTI crude | $80.85 | −4.75% |
| Brent crude | $83.79 | −4.05% |
The dollar is slipping on the Iran deal. Yields are falling. Oil is collapsing. Gold is the one asset with a conflicted reaction — safe-haven premium coming out (deal = less fear), but dollar weakness and falling real yields providing support.
The Iran deal: what's confirmed, what's disputed, and why it still matters for gold
The WSJ confirmed Sunday June 14 that "Iran and the US have agreed on an interim peace deal."3 Pakistan's Prime Minister Shehbaz Sharif — chief mediator — said a "final, agreed upon text has been reached." Trump said the Strait of Hormuz will reopen and Iran "will never have a nuclear weapon." A signing ceremony is expected Friday June 20.
What remains unresolved: a formal signing has not yet occurred as of Monday morning. Iranian officials have been careful to say only that the text is agreed, not that it is signed. The WSJ separately reported that "Trump's Iran deal still has to get past the Revolutionary Guard" and that "the accord will kickstart the toughest phase of talks" — meaning the current framework is a ceasefire/MoU, not a final comprehensive settlement.
The gold/Iran paradox explained: Over recent weeks, Iran escalation lowered gold even though it raised geopolitical fear, because it drove oil higher, which pushed inflation higher, which increased rate-hike probability. A deal reverses that chain: oil falls, inflation pressure eases, rate-hike probability falls, real yields decline, and gold can rise on the macro reprieve. Monday's reaction — gold up $88, oil down 4.75% — fits this logic precisely.
The risk: this is at minimum the 40th time in the past four months that Trump has announced or implied an Iran deal. Each previous announcement was followed by Iranian contradictions, missed deadlines, or disputed terms. Traders pricing in a done deal are taking deal-failure risk. If signing fails or Iran's FM contradicts terms again, oil reverses and the gold/rate-hike logic flips back.
Price channel and technical structure
Friday's close at $4,219 established Monday's open as a hard support test. The Monday surge already puts gold through the first resistance level analysts had been watching.
Key levels this week:
| Zone | Level | Status |
|---|---|---|
| Resistance 1 | $4,235 | Tested Friday — failed; now attempting above |
| Resistance 2 | $4,300–$4,310 | Current zone — needs to hold and retest as support |
| Resistance 3 | $4,366–$4,400 | Major former support turned resistance |
| Resistance 4 / 200-day MA | ~$4,446 | Descending resistance trendline intersects here |
| Prior ATH zone | $5,477–$5,595 | Long-term reference only |
| Support 1 | $4,219 | Monday open / Friday close — must hold on any pullback |
| Support 2 | $4,097–$4,098 | Last week's major swing low (March low) |
| Support 3 | $4,023 | June 11 six-month low |
| Psychological floor | $4,000 | Line in the sand if $4,023 breaks |
The technical read: gold broke below $4,098 last Thursday, nearly touched $4,000, then reversed sharply. FXEmpire's Bruce Powers noted a "failed breakdown" pattern as of Friday, which signals potential reversal.4 Forex.com's Fawad Razaqzada wrote that "$4,098 is now the first downside support — below that, $4,000 is the next key target" — and noted that "gold still needs to reclaim several broken support levels before the broader directional bias can be considered bullish again."5
The MA200 at ~$4,446 is the ceiling that defines the regime. A move above it — plus a clean break of $4,481 (last week's high) — is the line at which the current bearish structure breaks down. Until then, every rally is a potential short setup from resistance.
Trend indicators as of Friday's close: RSI ~59 (Buy), MACD +19.86 (Buy), but MA200 still Sell. Investing.com's automated technical summary: "Strong Buy" short-term.1
FOMC Wednesday: the week's single biggest catalyst for gold
This week is what KenMacro called "the biggest central bank week of the year" — five major rate decisions in three days.6 But for gold traders, only one truly matters: Wednesday June 17, 2PM ET — Kevin Warsh's first FOMC decision and press conference as Federal Reserve Chair.
What's priced: a hold at 3.50–3.75%, essentially fully. JPMorgan's Michael Feroli: "We expect no change in the fed funds target range... with no dissents."2 Reuters economists survey: no hike expected at this meeting.
What's not priced — and what will move gold: The dot plot and Warsh's tone at his 2:30PM press conference.
The FT reported that fed funds futures now price a single rate rise by year-end 2026.7 Raymond James: "The Fed's dot plot is likely to signal no rate cuts in 2026."8 Feroli noted: "Since the FOMC last met in late April, labor market data have firmed, and inflation has continued to run uncomfortably above the Fed's goal. These developments should push the committee in a more hawkish direction."2
The additional wildcard: Warsh has built his reputation as an inflation hawk who favors a leaner, less communicative Fed. WSJ's Alan Blinder wrote Saturday that Warsh will "move slowly" — but markets don't know if "slowly" means "cautious on hikes" or "cautious about pre-committing to cuts."9 Jerome Powell remains on the FOMC as an ordinary voting Governor, a historically unusual arrangement. Investopedia notes there is live speculation about whether Warsh scraps the dot plot entirely — something he has discussed publicly.10
The 2-year yield is the cleanest real-time tell: it reprices the rate path instantaneously. If it spikes Wednesday at 2PM, that's a hawkish dot shift. If it falls, the dots stayed benign.
Five FOMC scenarios with probability estimates and gold targets
This is a forecast, not a certainty. Probabilities are estimates based on current market pricing and analyst consensus; they will shift as Wednesday approaches.
| Scenario | Probability | Dot plot | Warsh tone | Gold reaction |
|---|---|---|---|---|
| Hold + status-quo dots + neutral tone | ~35% | 2026 cut survives in dots | Balanced, avoids hawkish pre-commitment | Rally continues; $4,350–$4,400 attainable |
| Hold + hawkish dots (no 2026 cut) + hard Warsh tone | ~30% | Cuts removed, hike language enters | Inaugural credibility play — tighter than Powell | Sharp reversal; $4,180–$4,220 retest |
| Hold + hawkish dots + dot plot scrapped | ~10% | No dot plot; hawkish statement language | Signals major regime shift | Deep uncertainty, high volatility; could test $4,100 on fear |
| Hold + neutral dots but surprise dissent toward hike | ~15% | Dots stable but 1–2 dissenters flag hike | Chair accommodating, hawks restless | Moderate pressure; $4,250–$4,270 |
| Surprise hike | ~5% | Irrelevant; decision speaks | — | Severe collapse; $4,000–$4,050 |
| Dovish surprise (cut language restored) | ~5% | 2026 cuts confirmed | Full easing pivot | Spike to $4,450+ |
Note: The Iran deal — if it holds — provides a secondary tailwind for the status-quo scenario by reducing oil-driven inflation pressure, giving Warsh more room to hold without sounding complacent.
Other central bank decisions and data this week
Beyond the Fed, this is a five-central-bank week.6
| Date / Time (ET) | Event | Consensus | Gold relevance |
|---|---|---|---|
| Mon Jun 15 | Empire State Mfg (Jun) | 13.2 (prev 19.6) | Low |
| Tue Jun 16 | Bank of Japan rate decision | Hike to 1.00% expected | Medium: BOJ hike → yen rally → carry unwind → broad FX volatility |
| Tue Jun 16 | RBA (Australia) decision | Hold at 4.35% | Low direct |
| Wed Jun 17 8:30AM ET | US Retail Sales (May) | +0.4% MoM | Medium: prints same hour as FOMC day warm-up |
| Wed Jun 17 2PM ET | FOMC rate decision + dot plot | Hold 3.50–3.75% | HIGHEST |
| Wed Jun 17 2:30PM ET | Warsh press conference | — | HIGHEST |
| Thu Jun 18 8:30AM ET | Swiss National Bank (SNB) | Hold 0.00% | Low |
| Thu Jun 18 noon ET | Bank of England | Hold 3.75% | Low–Medium |
| Fri Jun 19 | Juneteenth — US holiday | — | Thin liquidity; late FOMC repricing can run further than normal |
The BOJ is worth watching as an indirect gold driver: a BOJ hike into a Fed hold narrows the US-Japan rate gap, squeezing yen carry trades. A sharp yen rally on Tuesday morning could trigger broad position unwinds across risk assets including gold. USD/JPY is currently near 159.94 — close to the 160 zone where Japan has intervened before.6
Gold ETF flows and institutional positioning
GLD ETF holdings and weekly flows for the week of June 13 are not yet available as of Monday morning. The prior reported data point: JPMorgan estimated approximately $20 billion in gold ETF outflows during the week of June 5 — a significant institutional move that aligned with gold's drop from $4,480 toward $4,023.1 Traders should watch for this week's GLD flows data mid-week: a reversal toward inflows alongside the Iran deal and a neutral FOMC would confirm the institutional bid is returning.
5-day price outlook: Monday–Friday, June 15–19
These are probability-weighted ranges, not guarantees. Each scenario assumes the facts stated.
Loading chart…
Monday (today): Iran deal confirmation is driving the current +$88 move. Expect $4,270–$4,330 trading range if deal rhetoric holds. Watch $4,300–$4,310 as immediate resistance — a failure to hold above $4,300 into the NY close is early weakness.
Tuesday: BOJ decision overnight Asia-Pacific. A BOJ hike creates yen volatility, which can spill into gold. If no sign of FOMC surprise emerging, gold likely consolidates $4,250–$4,330.
Wednesday (FOMC day): Pre-decision drift possible. At 2PM ET, expect the largest intraday move of the week. A status-quo FOMC could push gold to $4,350–$4,400. A hawkish dot shift likely pulls gold back to $4,200–$4,250. The press conference (2:30PM) amplifies whichever direction the dots set.
Thursday: Post-FOMC digestion. BOE decision (noon ET) is secondary for gold. If FOMC was neutral, gold could grind toward $4,366–$4,400 resistance. If FOMC was hawkish, this is a potential oversold bounce opportunity near $4,200.
Friday: Juneteenth — US holiday. Thin liquidity. Any unfinished FOMC repricing can run further than it should. Avoid large positions Friday.
Trading strategy: long setup, short setup, and no-trade conditions
Long setup
- Entry zone: $4,250–$4,280 on any pullback that holds above $4,219 (Monday's open)
- Trigger: candle close above $4,310 on the 4H chart after FOMC confirms neutral/dovish
- Targets: $4,360 (first), $4,400 (second), $4,446 (200-day MA, stretch)
- Invalidation: close below $4,219 on the daily chart — that puts the $4,097–$4,100 range back in focus
Short setup
- Entry zone: $4,360–$4,400 (prior support, now heavy resistance zone)
- Trigger: clear rejection candle at resistance with 4H candle close below $4,340 after hawkish FOMC
- Targets: $4,260 (first), $4,220 (second), $4,100 (third / full breakdown scenario)
- Invalidation: daily close above $4,446 (200-day MA) — would shift the trend regime
No-trade conditions
- Between FOMC statement (2PM ET Wed) and end of press conference (approx 3:30PM ET): spreads widen, slippage risk is highest
- Any session where Iran deal is disputed or signing is delayed: gap risk is real in both directions
- Friday, June 19 (Juneteenth): avoid adding new positions in thin liquidity
Risk warnings
Main risk: The Iran deal is unsigned as of Monday. Trump has made dozens of similar announcements over the past four months, most of which were disputed or walked back within 48 hours. A deal-failure headline while gold is up $88 could trigger a sharp reversal — potentially $100–$150 on the day.
Fake-move risk (both directions): Gold's Monday surge is driven by a single geopolitical catalyst. Until a deal is formally signed, it remains headline-driven. A spike above $4,310 that then fails to hold is a classic fake-out — wait for a confirmed close, not just an intraday print.
FOMC news risk: Wednesday 2PM ET. The Warsh press conference has no historical precedent — markets don't know his communication style under pressure. Any unexpected language shift (or the absence of the dot plot) can create outsized volatility. Do not hold large unhedged positions into the FOMC decision.
Juneteenth liquidity risk: Friday is a US federal holiday. Gold markets technically operate, but US participation drops sharply. Late FOMC repricing or any Friday Iran news can cause exaggerated moves.
Data gap notice: GLD ETF flows for the week ending June 13 and US Retail Sales (May, prints Wednesday) have not yet been released at the time of publication. These figures could materially change the macro context mid-week.
All price levels are based on data available Monday June 15, 2026 pre-market. Scenario probabilities are estimates. No trading decision should be made based solely on this analysis. Every setup above has a defined invalidation level — use it.
References
- 1Investing.com XAUUSD live
- 2Gold gains on hopes for Iran peace deal, but falls for the week on rate jitters — Investing.com
- 3U.S. and Iran Say They Have Reached a Deal to Stop Fighting — WSJ
- 4Gold XAU/USD Price Forecast: Failed Breakdown Hints at Rebound — FXEmpire
- 5Gold weekly outlook: Central banks and US-Iran deal eyed — Forex.com
- 6Week Ahead 15-19 June 2026: FOMC, BOJ, BOE, SNB — KenMacro
- 7What to expect from the new Fed chair's inaugural rate meeting — FT
- 8Warsh's first FOMC meeting will put policy and Fed independence to the test — Raymond James
- 9As Kevin Warsh Arrives, Expect Him to Move Slowly — WSJ
- 10What To Expect From Wednesday's Fed Decision: Flat Interest Rates and a New Direction — Investopedia
Related content

Oil hits a 3-month low as gold rallies — the Iran deal's split verdict
Commodity Price Movement RecapArticle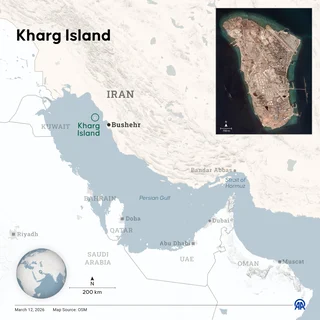
June 11, 2026 final settlements: Trump's Iran deal flips oil $8, gold bounces $187
Commodity Price Movement RecapArticle
Iran deal optimism obliterates the Hormuz premium — WTI crashes 5.6% to $88.68, gold breaks below $4,500
Commodity Price Movement RecapArticle
Add more perspectives or context around this Post.